Managing revenue in healthcare can be challenging, but tracking the right productivity KPIs makes a huge difference. Studies show that nearly 90% of claim denials are preventable, yet 35% of healthcare providers fail to appeal denied claims, leading to revenue loss.
Metrics like days in A/R (industry benchmark: 30–40 days), denial rates (average: 5–10%), and clean claim ratios (target: 95% or higher) help identify inefficiencies, reduce claim denials, and speed up reimbursements.
Healthcare organizations can improve staff performance, streamline workflows, and ensure compliance by regularly examining KPI trends. This will eventually increase cash flow and financial stability. In this blog, we will discuss the top 15 productivity KPIs in RCM and how to keep track of them.
What Are Productivity KPIs in RCM?
Productivity KPIs in RCM are quantifiable metrics used to measure the efficiency and effectiveness of revenue cycle operations. These KPIs assess various aspects of the revenue cycle, including medical billing accuracy, claim processing speed, denial management, and staff productivity.
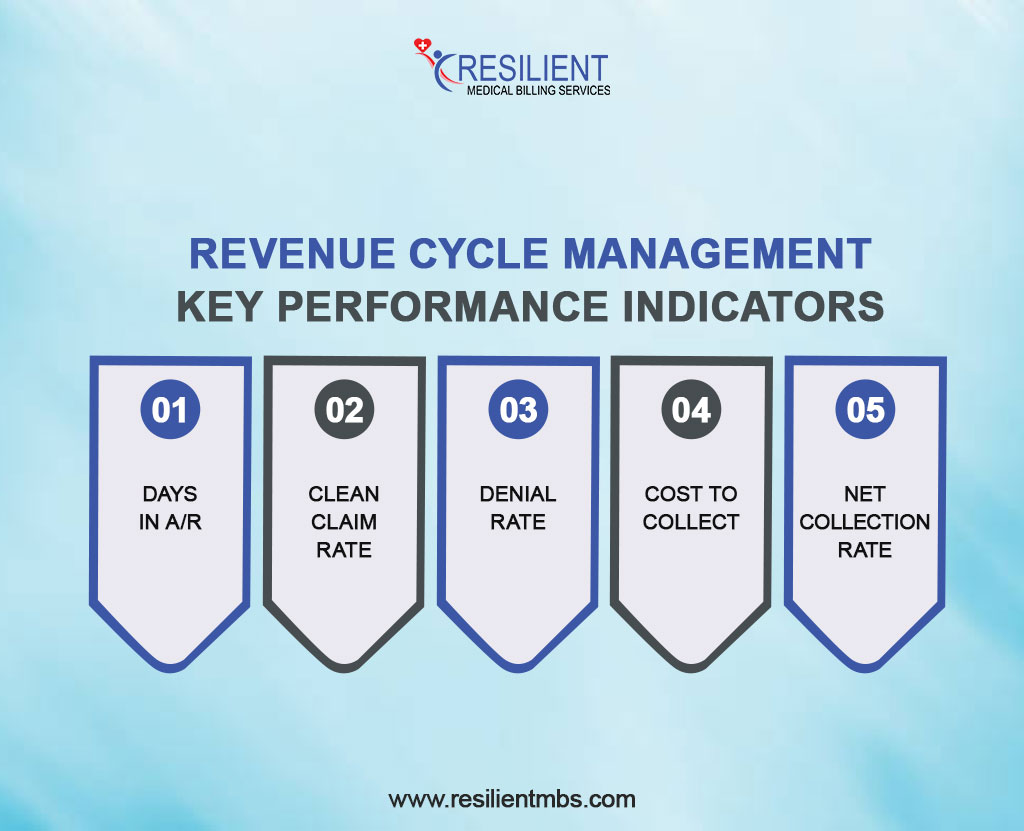
Revenue Cycle Management Key Performance Indicators include:
- Days in A/R: Measures the average days it takes to collect payments.
- Clean Claim Rate: The percentage of claims submitted without errors.
- Denial Rate: The percentage of claims denied by payers.
- Cost to Collect: The total cost incurred to collect payments from patients and insurers.
- Net Collection Rate: Measures the actual revenue collected compared to the expected revenue.
How They Impact Financial Performance and Operational Efficiency
By monitoring productivity KPIs, healthcare organizations can find ways to improve their revenue cycle processes. Too-long A/R days or a high rejection rate can be signs of inefficiencies that must be fixed.
By making the most of these KPIs, providers can lower their business costs, improve their cash flow, and improve their finances.
Also, healthcare workers can focus on caring for patients instead of paperwork when they have good revenue cycle management.
Benefits Of Using a Revenue Cycle KPI Dashboard for Monitoring
Revenue cycle KPI dashboards analyze vital performance KPIs in real time. Financial performance dashboards help healthcare professionals make wise choices. Benefits of a KPI dashboard include:
- Enhanced visibility into revenue cycle operations
- Real-time tracking of financial and operational revenue cycle metrics
- Data-driven decision-making to improve efficiency
- Improved accountability and performance measurement
Top 15 Productivity KPIs in RCM and Their Tracking Methods
Healthcare firms need good revenue cycle management (RCM) to stay afloat. Tracking KPIs helps providers simplify invoicing, reduce claim denials, and increase revenue.

The top 15 RCM productivity KPIs and how to track them are:
1. Clean Claim Rate (CCR)
Measures the percentage of claims submitted without errors on the first attempt.
Tracking Method: Use claim management software to monitor error-free claim submissions. A high CCR indicates efficient billing processes and reduced rework.
2. First Pass Resolution Rate (FPRR)
Tracks the percentage of claims paid on first submission without resubmission or appeal.
Tracking Method: Analyze claims data from the billing system to measure the rate of first-pass payments.
3. Denial Rate
Percentage of claims denied by payers.
Tracking Method: Calculate the number of denied claims divided by the total submitted claims. A lower denial rate indicates better coding and billing accuracy.
4. Days in Accounts Receivable (A/R Days)
The average number of days it takes to collect payments from payers and patients.
Tracking Method: Divide total outstanding A/R by the average daily charges. Lower A/R days indicate faster revenue collection.
5. Net Collection Rate (NCR)
Measures the percentage of revenue collected after adjustments.
Tracking Method: Divide total payments by total expected collections. A higher NCR signifies effective revenue cycle operations.
6. Bad Debt Rate
Percentage of uncollected revenue written off as bad debt.
Tracking Method: Calculate the total lousy debt divided by total billed revenue. A lower rate indicates better financial performance.
7. Charge Capture Accuracy
Tracks errors in medical coding and charge entry.
Tracking Method: Automate charge capture solutions to identify discrepancies and reduce billing errors.
8. Patient Payment Collection Rate
Measures the effectiveness of front-end collections.
Tracking Method: Compare collected patient payments against total patient responsibility. A high rate indicates strong front-office financial processes.
9. Cost to Collect
Total revenue cycle expenses divided by collections.
Tracking Method: Calculate all RCM expenses and divide by the total collected revenue. Lower costs indicate more significant efficiency.
10. Denial Recovery Rate
Definition: Percentage of denied claims successfully appealed and recovered.
Tracking Method: Track the number of denied claims successfully overturned and paid.
11. Average Reimbursement per Encounter
Tracks revenue generated per patient visit.
Tracking Method: Divide total revenue by the number of patient encounters. This metric helps assess pricing strategies and payer reimbursement levels.
12. Claim Lag Days
Measures the time taken from the service date to claim submission.
Tracking Method: Monitor the average days between service and claim submission. A lower claim lag improves cash flow.
13. Payer Mix Analysis
Identifies the distribution of payments from different insurers.
Tracking Method: Evaluate revenue contributions from various payers to understand dependency and diversify payer sources.
14. Staff Productivity Rate
Measures the efficiency of billing and coding teams.
Tracking Method: Track the number of claims processed per staff member to assess efficiency and resource allocation.
15. Collection Effectiveness Index (CEI)
Evaluates the overall efficiency of revenue collection.
Tracking Method: CEI is calculated using the formula: (total payments / total payments + outstanding A/R) * 100. A higher CEI reflects a more effective collection process.
KPI Metrics for Medical Billing
Medical billing KPIs measure efficiency, profitability, and revenue cycle performance. A/R, which measures how long claims go unpaid, and CCR, which measures the percentage of claims approved without modifications, are essential KPIs.
Denial Rate helps discover billing mistakes by measuring claim rejections. First-Pass Resolution Rate (FPRR) shows how many claims are paid on the first filing, whereas Net Collection Rate compares revenue to expected reimbursements. Healthcare providers increase cash flow, claim denials, and financial health by monitoring these healthcare revenue cycle KPIs.
Final thoughts
For the revenue cycle to be effective, keeping an eye on and improving RCM efficiency KPIs is essential. Claims denial rates, days in arrears, clean claim rates, and patient collection rates are some of the most critical measures that show how well a business is doing financially.
Long-term revenue cycle management depends on being proactive about watching KPIs, using automation, and putting in place AI-driven solutions. Continuous improvement leads to more cash flow, fewer claims being turned down, and more efficient operations.
Use KPI-driven tactics to improve the results of your revenue cycle. Get in touch with Resilient MBS right away for expert advice on improving your RCM processes and making your business more profitable.


